

Pinterest infographics: less text, a clearer explanation
Your article explains how to prepare for a curtain consultation. Then you decide to make an infographic and move all the words onto a picture. Now you have an article nobody can comfortably read.
An infographic isn't a way to squeeze in more text. It helps readers see a relationship: what to compare, which order to follow or where to look.
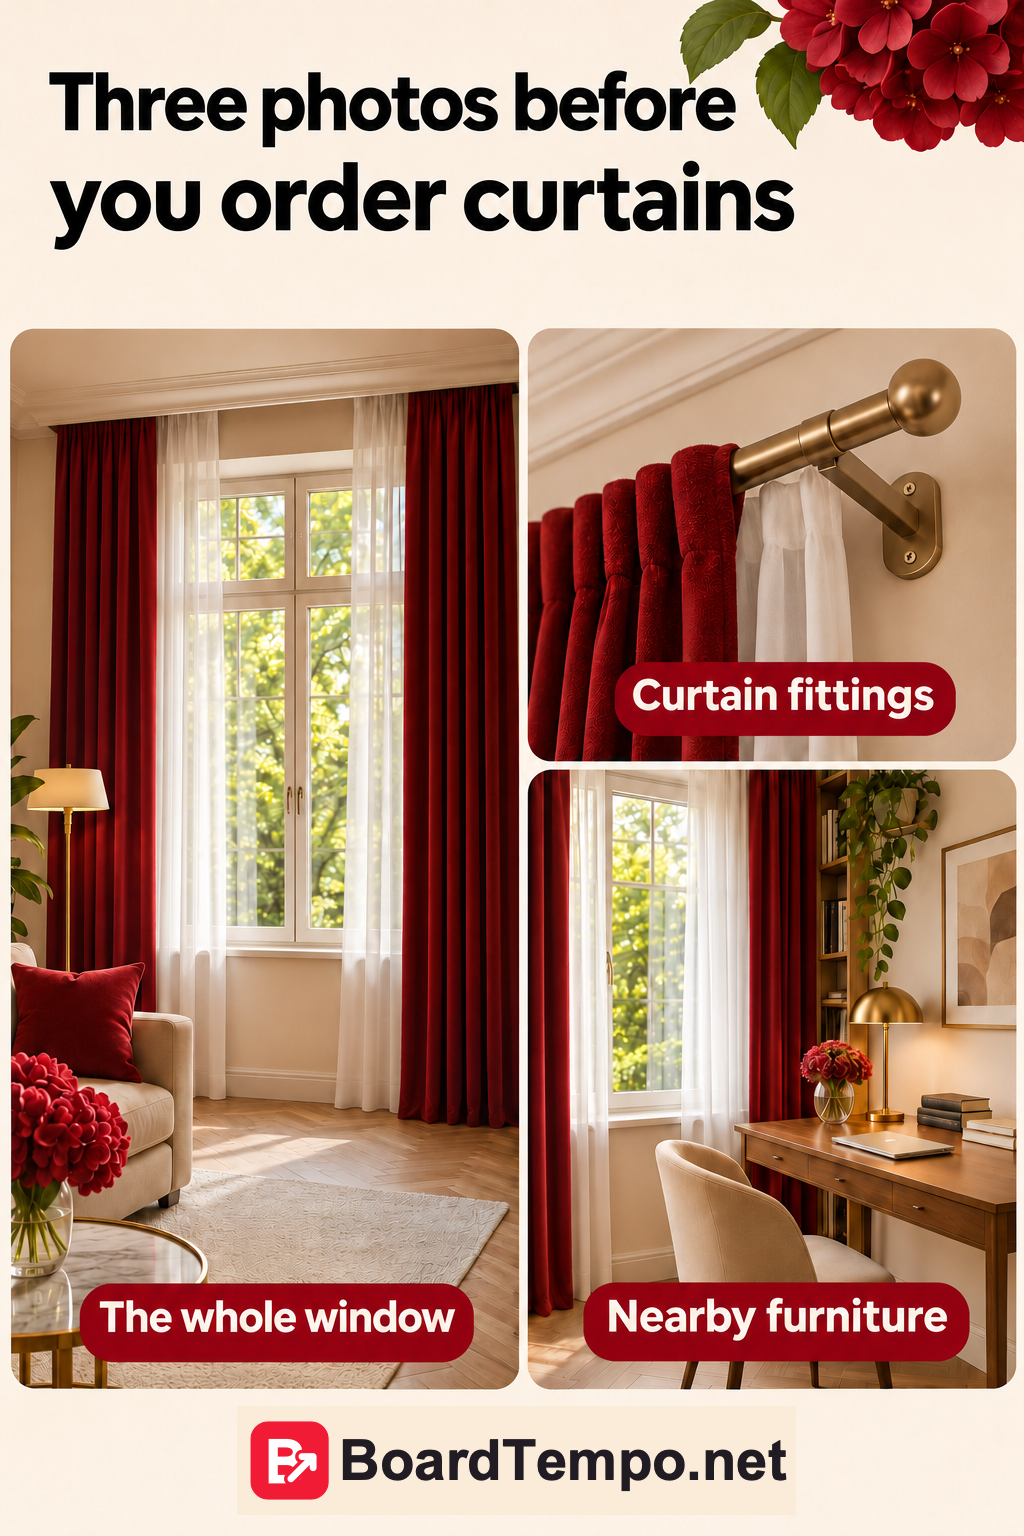
Give it one job
For example, show which photos of a window would help before discussing new curtains: the whole window, the fittings and nearby furniture. Three small pictures can explain that faster than a long paragraph.
Fabric, measurements, fittings, washing and price don't all belong on the same image. Those are several conversations. Make separate pieces and link them where a follow-up would genuinely help.
Choose a form that suits the explanation
Use steps for a sequence, side-by-side examples for a comparison, and a labelled diagram to explain the parts of something.
If you're discussing curtain length, show a window and where the fabric ends. If you're helping readers prepare for a consultation, show the photos to take. Don't add a pie chart because it looks serious. Without data, it has nothing to say.
Numbers should mean something. “3 photos for your curtain consultation” should contain three useful photos, not two tips and an invitation to subscribe.
Shorten the labels, not the meaning
Instead of “To provide a comprehensive understanding of the space, it is recommended that a photograph be supplied,” write “Photograph the whole window.” There. Much easier.
A small drawing doesn't need half a screen of explanation beside it. Use a short label and put important detail in the article. A photo of the fittings, for example, helps you discuss options, but doesn't replace accurate measurements.
Use clear contrast, type large enough to read and space between sections. For a static Pin, Pinterest's recommended 2:3 format is a useful starting point. Then check it on a phone.
Does the image promise too much?
A tidy diagram looks convincing. That makes it especially important not to turn a practical suggestion into a universal rule.
“Show these areas before your consultation” is a useful recommendation. “The only correct way to hang any curtains” goes too far. Different poles, fabrics and rooms call for different decisions.
The same applies to statistics. If a number comes from research, give the source and period. If you don't have data, don't add percentages to look authoritative. Three well-chosen examples can manage perfectly well without a growth chart.
Try this with one article
Open an article you've written and find a point that's easier to show than explain. Sketch it on paper. Even three boxes with labels can tell you whether the idea works.
Ask someone to explain what they understood from the sketch without reading the article. If their answer doesn't match your intention, improve the explanation before adding decoration.
Then use your project's colours, add a small logo and link to the full explanation. On the website, include the diagram's meaning in the text too, so readers who can't easily view the image don't miss it.
One article may contain several ideas for self-contained diagrams. We explain how to find those angles in “One article, several Pins.”
Source
Let’s talk about it
What could help your project? Share your experience or ask a question.
The discussion will appear here after this article is posted in our Telegram channel and comments are enabled. You can visit the channel meanwhile. Comments are public; you are not automatically subscribed.
Telegram loads only when you click. Telegram may ask you to log in to comment. If the discussion is not available, use the channel link above.